Draw beautiful
Economics diagrams,
interactive by design.
A diagram tool tailored for the IB Diploma Economics syllabus. Fully configurable curves, shaded welfare areas, and live calculations — built for real understanding.
Start free — no cardEverything a diagram should be.
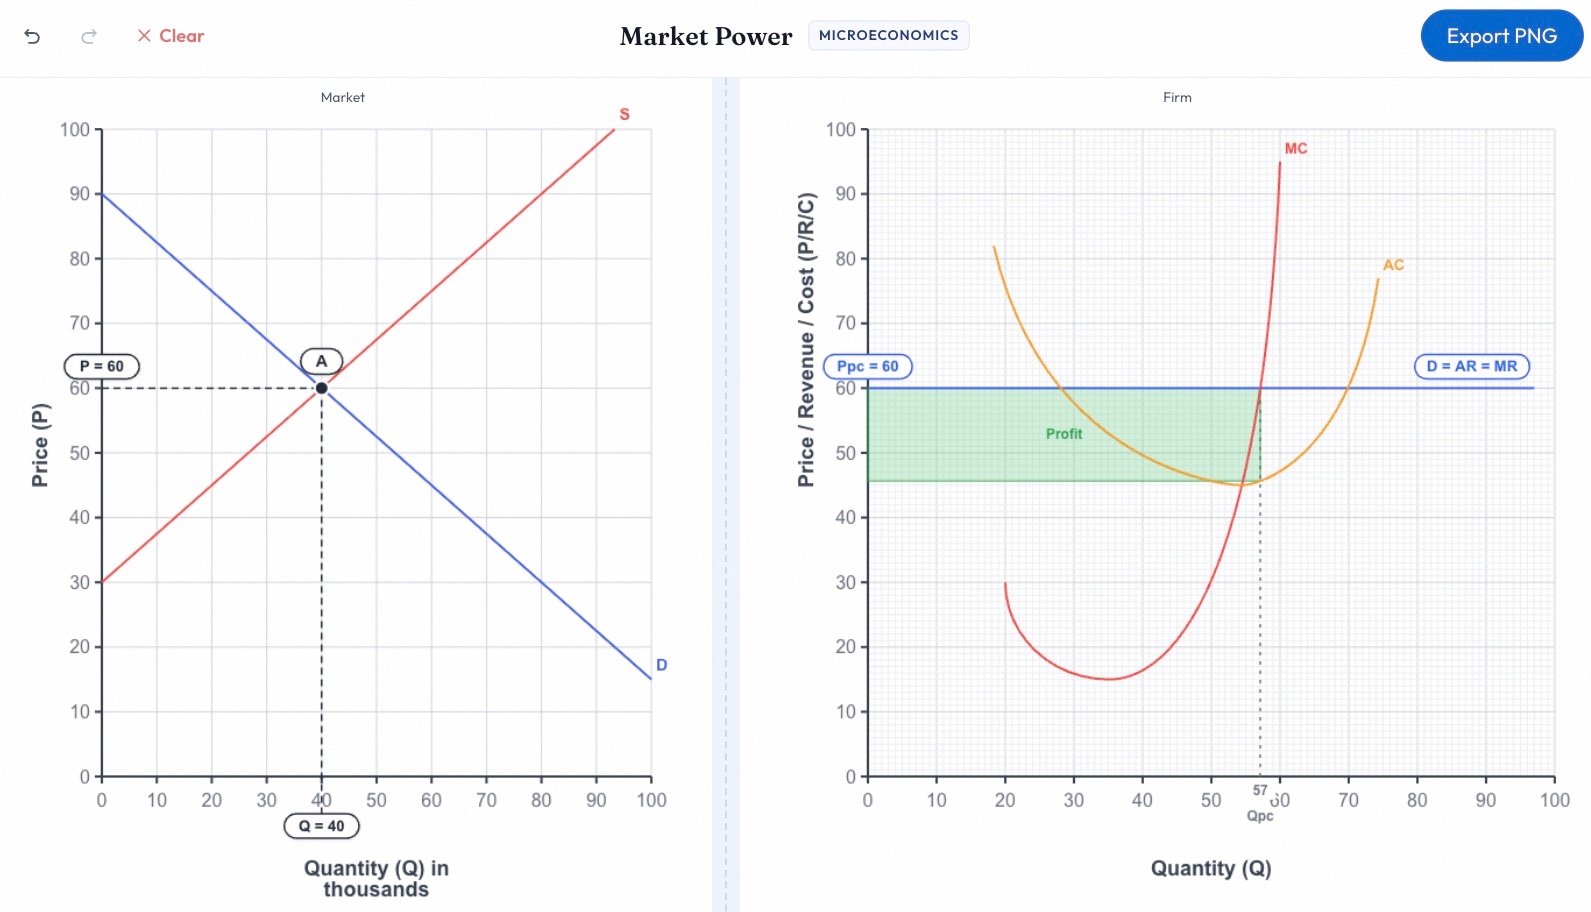
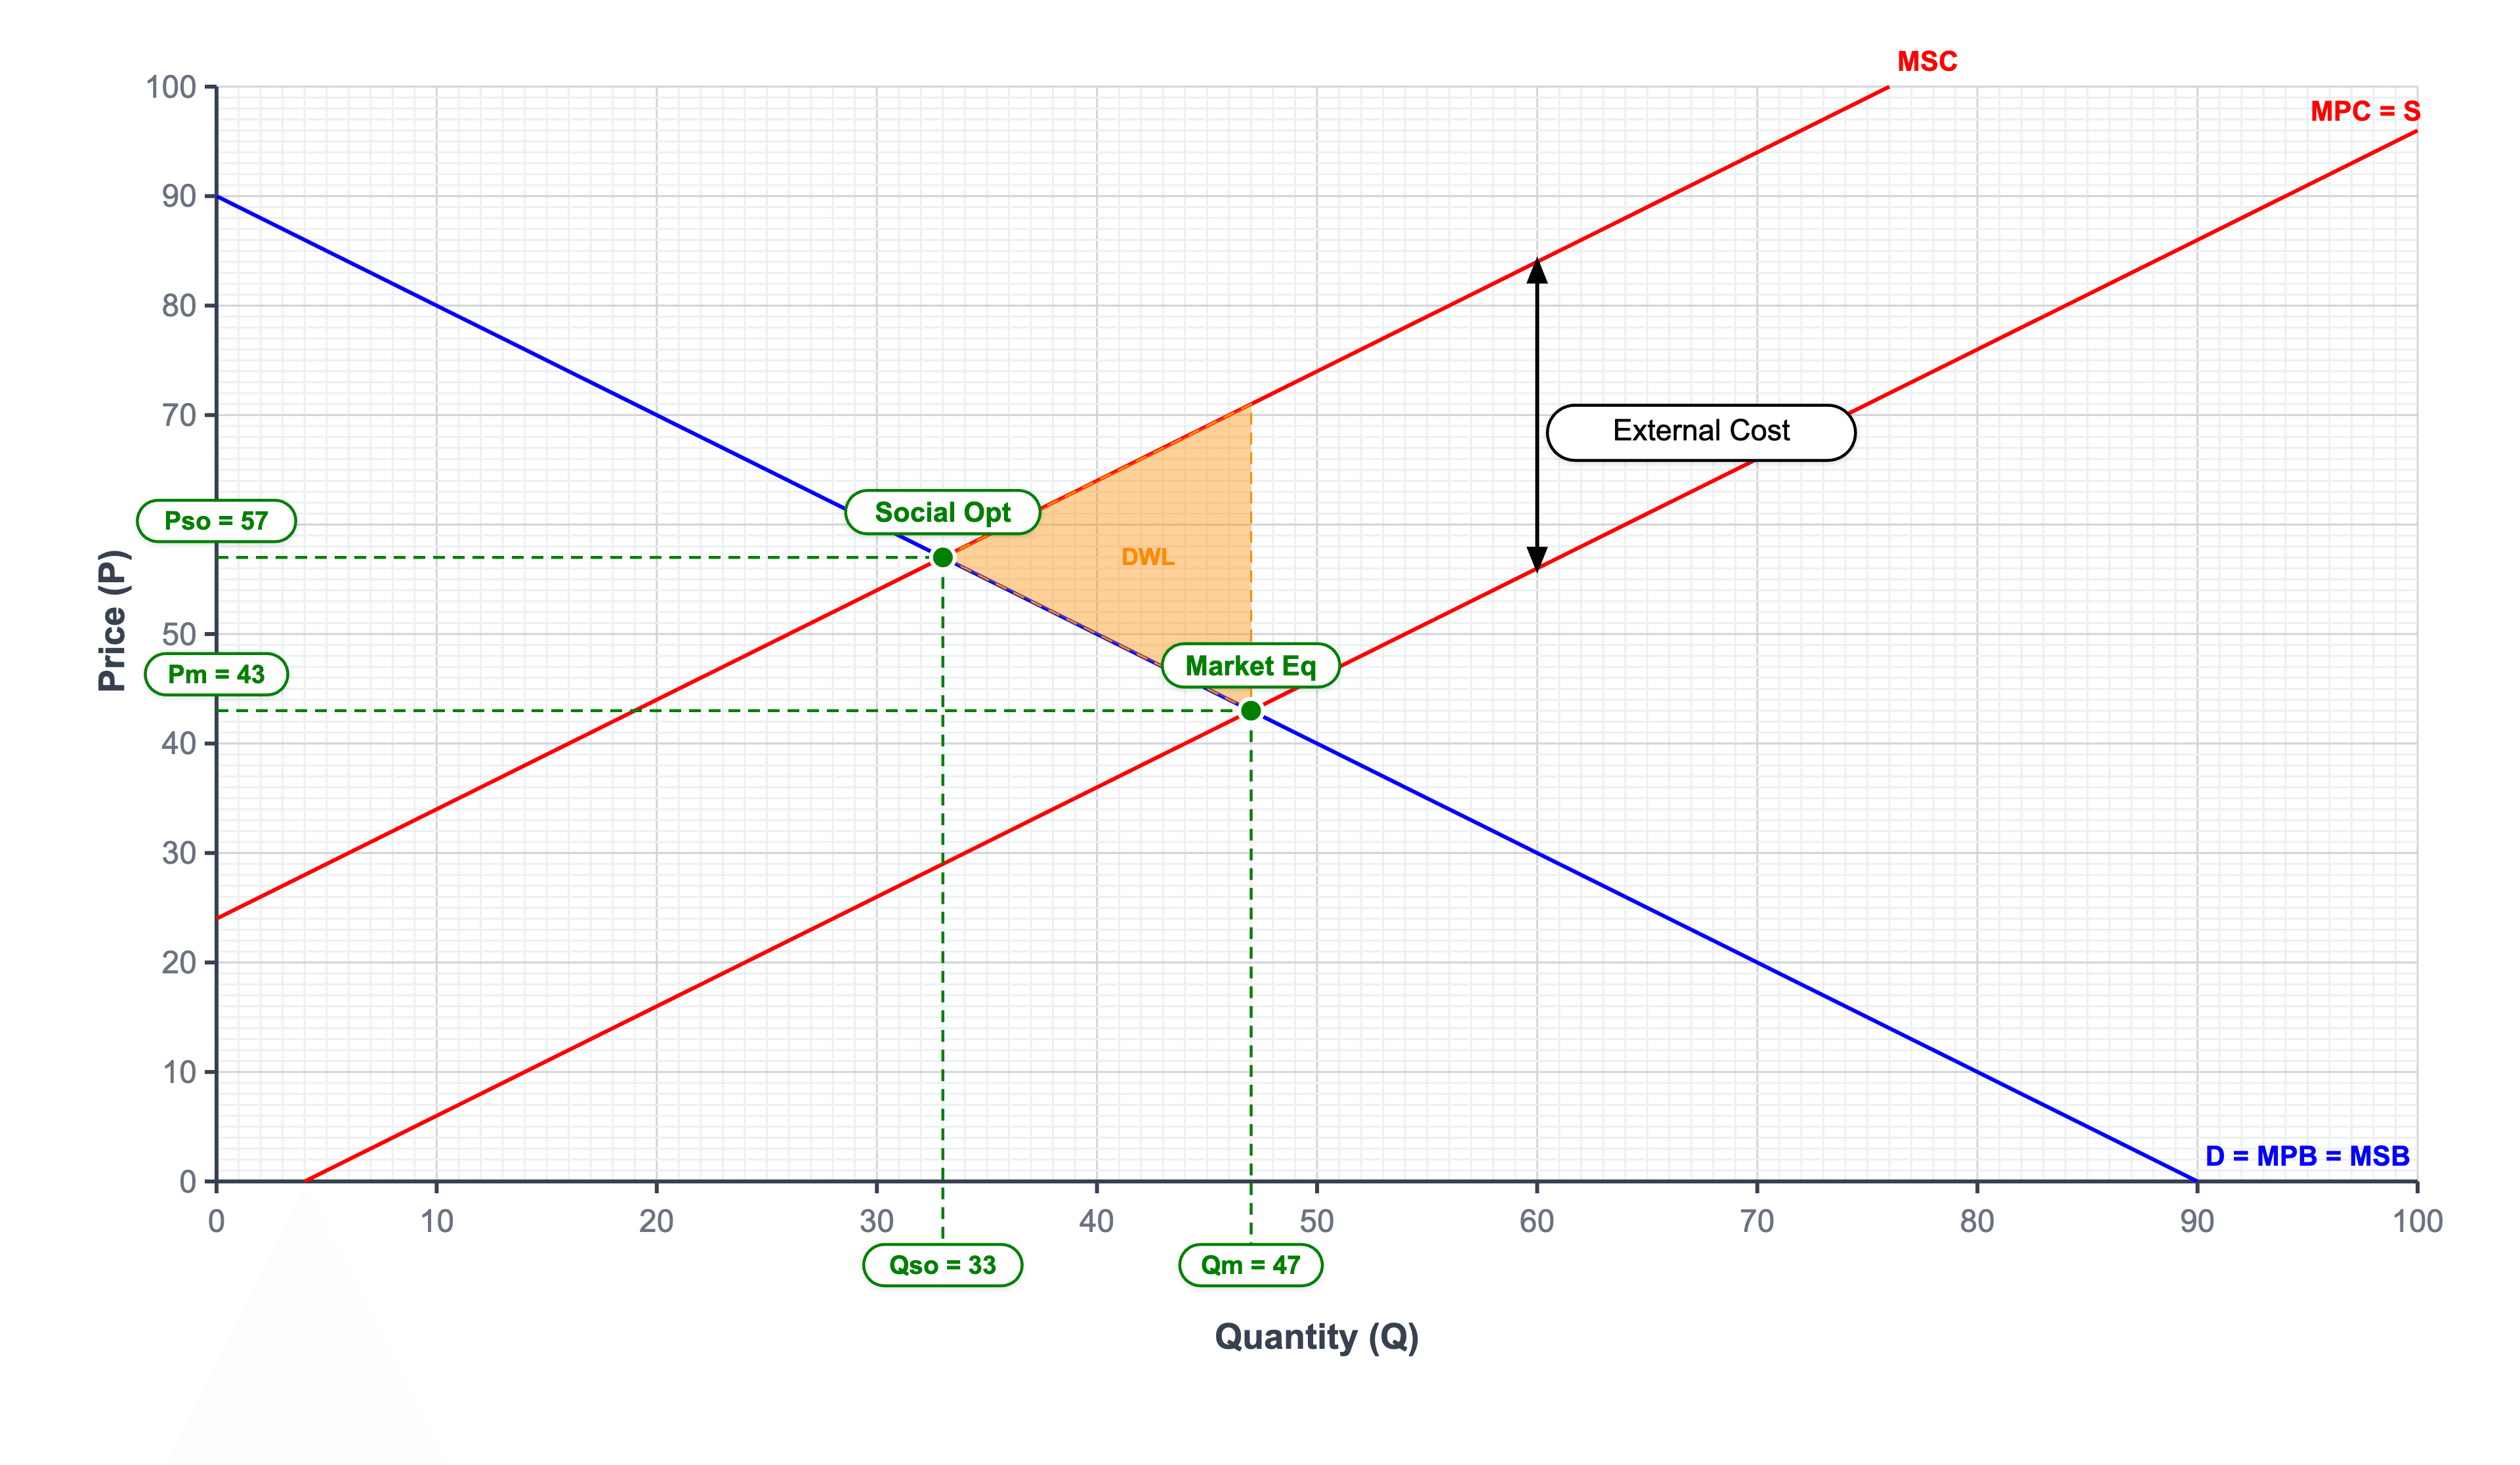
Drag curves, shift points, relabel anything. Supply and demand, externalities, monopoly — every element is editable in real time.
Instantly visualize consumer surplus, producer surplus, deadweight loss, and tax revenue. Areas update as you move curves — perfect for interactive learning.
Explore taxes, subsidies, revenue, and welfare. Numerical answers update instantly as you change values — ideal for Paper 2 and Paper 3 practice.
Syllabus coverage, from unit 1 to unit 4.
Over 50 templates. Every diagram the IB Economics course asks for — drawn properly, with correct axis labels and areas shaded the way examiners expect.
 After tariff
 Before tariff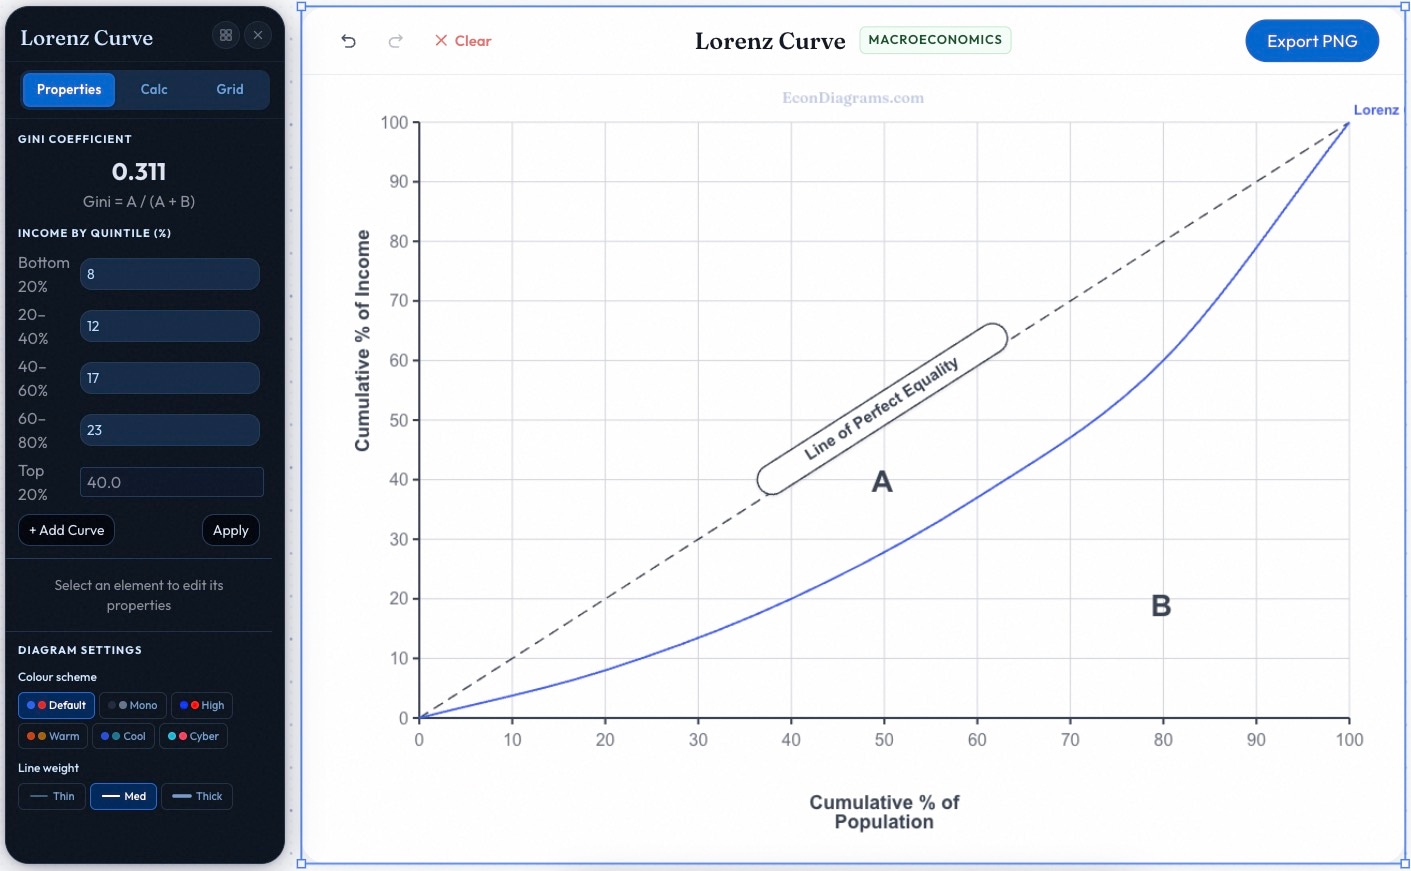
One plan. No surprises.
- ✓ 1 whiteboard
- ✓ Up to 3 diagrams
- ✓ 1 collection
- ✓ Full diagram editor & calculations
- ✓ Export as image
- ✓ Unlimited whiteboards
- ✓ Unlimited diagrams per whiteboard
- ✓ Unlimited collections for organising work
- ✓ Full diagram editor & calculations
- ✓ Priority email support
- ✓ Early access to new templates
“I’ve been teaching IB Economics for over 14 years — as a teacher, tutor, and examiner. Every diagram in this tool comes from what my students actually needed to succeed. Built for IB students and the teachers who support them.”

Better diagrams.
Better commentaries.
Better grades.
Free forever on the starter plan. The Pro plan is currently available to selected beta testers only. No card required to sign up.
Start freeNo spam · No card · Cancel anytime